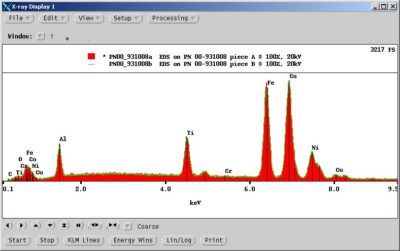
A typical EDX SPECTRA (elemental) result is shown in photo at left. The elemental spectral peaks are identified during the x-ray scan. The individual elements are indicated in the spectra by both their intensity and scan position. The greater the intensity, the higher the element concentration in the sample.
The spectra shown illustrates the elemental results for a sample containing significant amounts of Iron (Fe) and Cobalt (Co). Although these primary magnetic elements are present in the sample their weight percents vary in concentration.
The super-positioning of the comparative spectra can also be demonstrated and are summarized in the clients’ analysis reports.
The elemental weight percents for each samples is also collected. Data from these test results are used in elemental concentration Tables to identify and illustrate material composition differences. Similarities and differences are best identified by the weight percentage data from the sample data reports. The comparative elemental analysis of the different samples is also included in the Summary section of the customer report.