The Hysteresis Curve
ARkival reports Hysteresis curves and key magnetic parameters
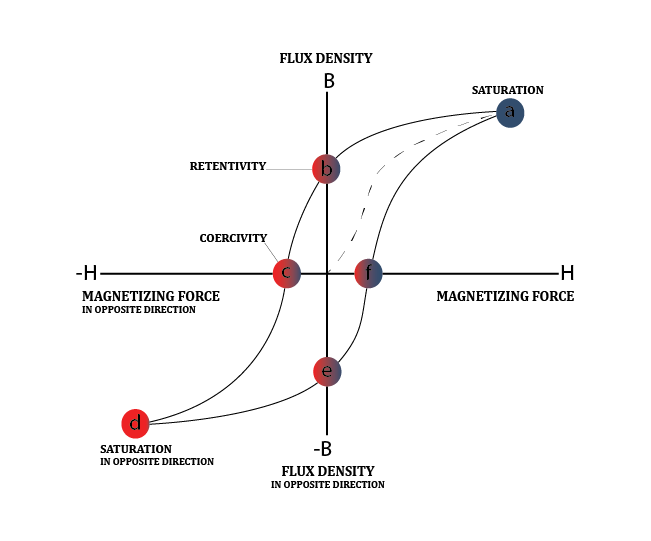
The hysteresis curve reports the magnetic properties of a material. The data curve is often referred to as the ‘B-H loop’ and expresses the relationship between two important magnetic parameters, the letter (B) is used for the responsive magnetic moment (or flux density) parameter and the letter (H) for the applied magnetic field (or magnetizing force) parameter.
A sample hysteresis loop is shown above.
The Hysteresis curve is obtained by reporting the magnetic moment (B) of a magnetic material while the magnetizing field (H) is being changed.
For most materials, a point in the measurement is reached when the material is fully magnetized and additional increases in the magnetizing field produces little or no change in magnetic moment. The material has then reached the point of magnetic saturation.
The data from the Hysteresis curve reports the following magnetic parameters of the material:
- the magnetic saturation of the material (Bsat)
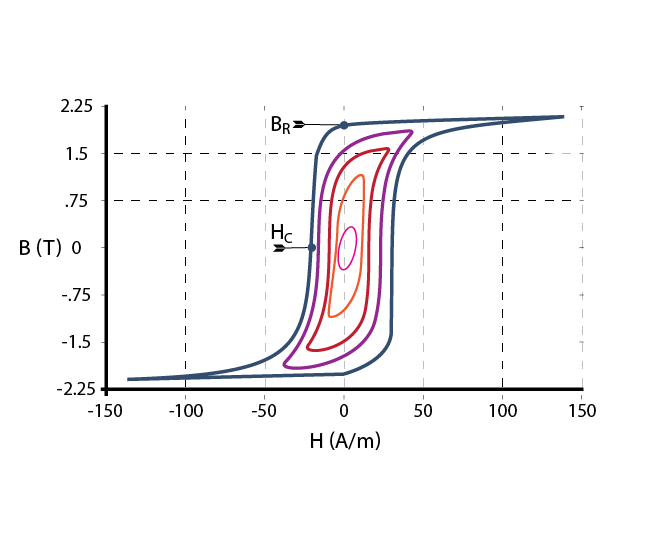
- the Retentivity (Br) or the remanence or residual magnetism
- the coercivity (Hc) – The force required to remove the residual magnetism from the material, termed the coercive force
- the Permeability, µ -the property of a material that describes the ease or difficulty in which a magnetic moment is generated in the material
- and more…
Coercivity
ARkival Technology has developed a fast and accurate measurement means for AC magnetic fields and their corresponding AC frequencies in/for magnetic devices. Using both precision Hall probe and Miniature Coil probe access, AC field measurements are now possible with calibrated accuracy referenced to standardized sources and calibration materials[2]. AC Field measurements can be performed in either 1D, 2D or 3D modes at specific measurement location(s) or over larger areal regions of interest by employing either precision manual testing or automated robotic testing, both with and without optional magnetic field mapping technology.
Permeability
ARkival’s focus on the accurate measurment of AC material properties using precision magnetometers typically limits the material sample size to “small” rather than “large”. In many cases, test samples must be prepared for analysis and the sample preparation options are discussed with clients prior to measurment.
About VSM Permeability Reporting
Permeability reporting is a complicated topic and one in which ‘clean definitions’ and standardized units are difficult to come by. Nevertheless, it is a commonly used term by equipment and product designers and most often confused by definitions, reporting units and manufacturer’s specification all with an abundance of footnotes.
Measurement and Reporting
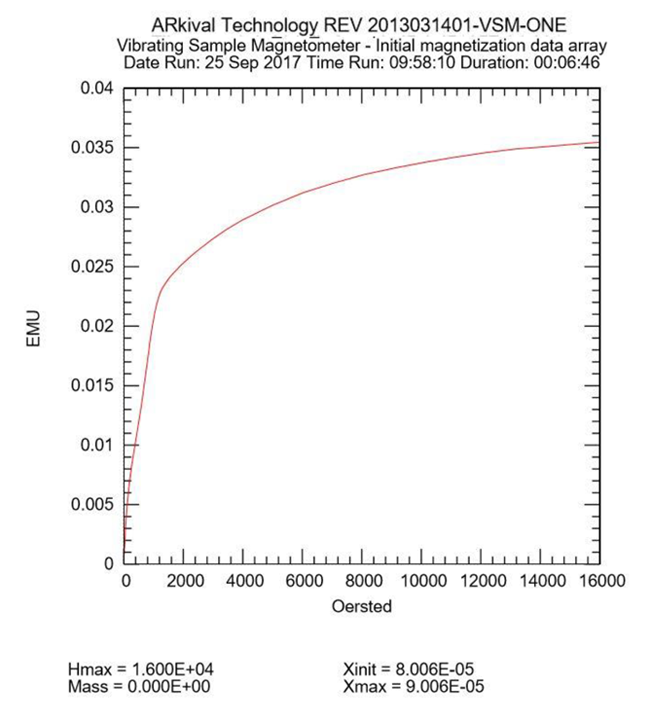
Permeability traces are always initiated from an erased sample (ARkival uses a DC erase procedure. The applied field is then increased (starting from zero) until full saturation takes place. The illustration shown below is that of the full permeability trace with an applied field of 16,000 Oersted.
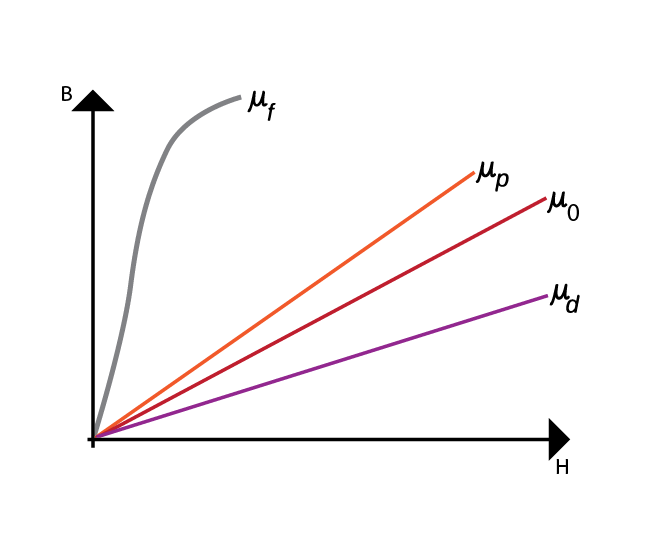
In the measurement and reporting from ARkival’s VSM’s, the determination of the permeability is available with several different measurement options; each is different enough to serve different specific purposes, while all options are reported under the same general reporting term of ‘permeability’.
ARkival reports permeability data from three SLOPE measurements from the B-H permeability trace (below-left); they are: ‘X init’ slope, ‘X max’ slope and ‘90% slope. The X init, X max and 90% slopes are designated at three different regions of the permeability trace.
Permeability and System Unit Conversions
ARkival Technology reports all magnetic data in fundamental electromagnetic units (EMU)[1]. A typical permeability trace is shown in the figure below left. Reported at the bottom of the PDF are the two permeability-equivalent data values discussed above: Xinit and Xmax. The units for these calculated slopes are EMU/ Oersted or upon request, can be presented as Gauss/ Oersted.
In 2019[2] the standardized units for magnetic reporting became SI compared to Gaussian units. Subsequently, data unit conversions may be required and should be identified as such when requesting sample measurements.
Permeability data is reported in units of Gauss, Oersteds, Tesla.and SI units of ‘ampere per meter’.
[1] EMU is ARkival’s preference in reporting because it is the most fundamental unit in magnetics and conveniently used when converting between different magnetic units.
[2] In 2019, the SI base units were redefined in agreement with the International System of Quantities, effective on the 144th anniversary of the Metre Convention, 20 May 2019
Relative Permeability
What is common in the workplace, however, is the requirement to compare permeability differences between materials for specific applications. When required, a consistent method for relative permeability measurements is used for identifying differences between magnetic materials. In its original definition relative permeability defined a material property measured in a vacuum compared to free space.
In common usage the term “Relative Permeability is defined as the ratio of the effective permeability to a given reference material at its maximum saturation However this is a loose definition and the “fine print’ of the permeability report must be read in detail.
[1] EMU is ARkival’s preference in reporting because it is the most fundamental unit in magnetics and conveniently used when converting between different magnetic units.
[2] In 2019, the SI base units were redefined in agreement with the International System of Quantities, effective on the 144th anniversary of the Metre Convention, 20 May 2019